Throughout this project I wanted to explore a dataset from sedelmeyer/predicting-crime. This dataset contains several features, which are explained in the following table:
| Variable | Description |
|---|---|
lat and lon |
These are the latitude and longitude coordinates for each observed crime record. |
day-of-week |
This is a one-hot-encoded categorical variable split into the individual predictors Tuesday, Wednesday, Thursday, Friday, Saturday, and Sunday, indicating the day of the week during which the incident occurred. |
month-of-year |
This is a one-hot-encoded categorical variable split into the individual predictors Feb, Mar, Apr, May, Jun, Jul, Aug, Sep, Oct, Nov, and Dec indicating the month of the incident. |
night |
This is a binary variable indicating whether the crime occurred before sunrise or after sunset for the given day of the crime record. Sunrise and sunset times were derived from NOAA daily local climatological data for the City of Boston. |
streetlights-night |
This is an interaction term measuring the number of streetlights within a 100 meter radius of each crime record that occured at night. Daytime crime records are zero-valued for this predictor. |
tempavg |
This is the average dry bulb temperature in celcius for the City of Boston for the date on which each crime record occured. |
windavg |
This is the average daily windspeed in kilometers-per-hour in the City of Boston for the date on which each crime record occured. |
precip |
This is the amount of precipitation in inches that fell in the City of Boston for the date on which each crime record occured. |
snowfall |
This is the amount of snow in inches that fell in the City of Boston for the date on which each crime record occured. |
college-near |
This is a binary indicator identifying whether or not the crime occured within 500 meters of a college or university. |
highschool-near |
This is a binary indicator identifying whether or not the crime occured within 500 meters of a public or non-public highschool. |
median-age |
This is the median age of residents in the Boston neighborhood in which the crime record occured. |
median-income |
This is the median household income of residences in the Boston neighborhood in which the crime record occured. |
poverty-rate |
This is the proportion of residents living in poverty in the Boston neighborhood in which the crime record occured. |
less-than-high-school-perc |
This is the percentage of residents who achieved less than a highschool degree in the Boston neighborhood in which the crime record occured. |
bachelor-degree-or-more-perc |
This is the percentage of residents who attained a bachelor’s degree or higher level of education in the Boston neighborhood in which the crime record occured. |
enrolled-college-perc |
This is the percentage of residents enrolled in college in the Boston neighborhood in which the crime record occured. |
residential-median-value |
This is the annual median property value for all residential properties in the census tract and during the year in which the crime records occured. |
commercial-mix-ratio |
This is the ratio of total assessed value of commercial properities divided by the total assessed value of all properties in the census tract and during the year in which the crime record occurs. |
industrial-mix-ratio |
This is the ratio of total assessed value of industrial properities divided by the total assessed value of all properties in the census tract and during the year in which the crime record occurs. |
EDA
I wanted to reproduce an exploratory data analysis and some machine learning models to this dataset as it was extremely interesting, plus super useful to train several coding skills.

Also, as there were present the latitude and longitude for each crime it was interesting to provide some interactive maps to visualize the total crime in the city.
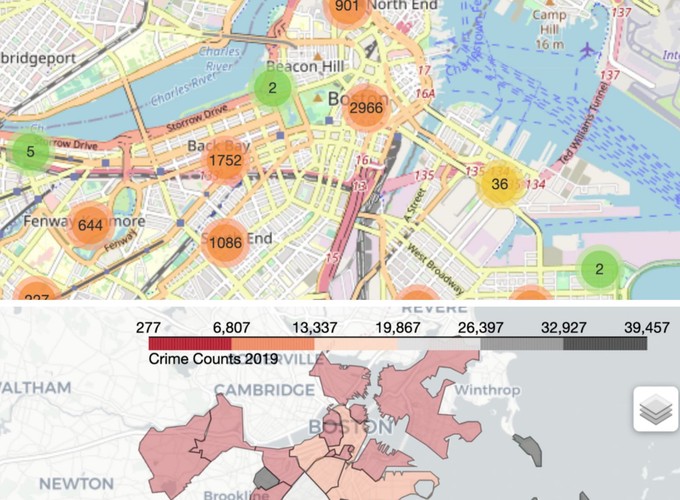
Clustering Markers
The first map is intended to show the clusters of the crimes exact location in the city. This means that according to the zoom level, it aggregates the closest events.

Choropleth Map
Secondly, to have a direct understanding of the total amount of crimes by neighborhood I have then plotted a choropleth map:

Machine Learning
Among the MLmodels, I have tuned and fitted a Random Forest and a Gradient Boosting Machine, to compare with a Logistic Regression. For each model, I have then computed the metrics, the confusion matrix and plotted some metric curves.
