A lo largo de este proyecto quise explorar un conjunto de datos de sedelmeyer/predicting-crime. Este conjunto de datos contiene varias características, que se explican en la siguiente tabla:
| Variable | Description |
|---|---|
lat and lon |
These are the latitude and longitude coordinates for each observed crime record. |
day-of-week |
This is a one-hot-encoded categorical variable split into the individual predictors Tuesday, Wednesday, Thursday, Friday, Saturday, and Sunday, indicating the day of the week during which the incident occurred. |
month-of-year |
This is a one-hot-encoded categorical variable split into the individual predictors Feb, Mar, Apr, May, Jun, Jul, Aug, Sep, Oct, Nov, and Dec indicating the month of the incident. |
night |
This is a binary variable indicating whether the crime occurred before sunrise or after sunset for the given day of the crime record. Sunrise and sunset times were derived from NOAA daily local climatological data for the City of Boston. |
streetlights-night |
This is an interaction term measuring the number of streetlights within a 100 meter radius of each crime record that occured at night. Daytime crime records are zero-valued for this predictor. |
tempavg |
This is the average dry bulb temperature in celcius for the City of Boston for the date on which each crime record occured. |
windavg |
This is the average daily windspeed in kilometers-per-hour in the City of Boston for the date on which each crime record occured. |
precip |
This is the amount of precipitation in inches that fell in the City of Boston for the date on which each crime record occured. |
snowfall |
This is the amount of snow in inches that fell in the City of Boston for the date on which each crime record occured. |
college-near |
This is a binary indicator identifying whether or not the crime occured within 500 meters of a college or university. |
highschool-near |
This is a binary indicator identifying whether or not the crime occured within 500 meters of a public or non-public highschool. |
median-age |
This is the median age of residents in the Boston neighborhood in which the crime record occured. |
median-income |
This is the median household income of residences in the Boston neighborhood in which the crime record occured. |
poverty-rate |
This is the proportion of residents living in poverty in the Boston neighborhood in which the crime record occured. |
less-than-high-school-perc |
This is the percentage of residents who achieved less than a highschool degree in the Boston neighborhood in which the crime record occured. |
bachelor-degree-or-more-perc |
This is the percentage of residents who attained a bachelor’s degree or higher level of education in the Boston neighborhood in which the crime record occured. |
enrolled-college-perc |
This is the percentage of residents enrolled in college in the Boston neighborhood in which the crime record occured. |
residential-median-value |
This is the annual median property value for all residential properties in the census tract and during the year in which the crime records occured. |
commercial-mix-ratio |
This is the ratio of total assessed value of commercial properities divided by the total assessed value of all properties in the census tract and during the year in which the crime record occurs. |
industrial-mix-ratio |
This is the ratio of total assessed value of industrial properities divided by the total assessed value of all properties in the census tract and during the year in which the crime record occurs. |
EDA
Quería reproducir un análisis de datos exploratorio y algunos modelos de aprendizaje automático a este conjunto de datos, ya que era extremadamente interesante, además de súper útil para entrenar varias habilidades de codificación.

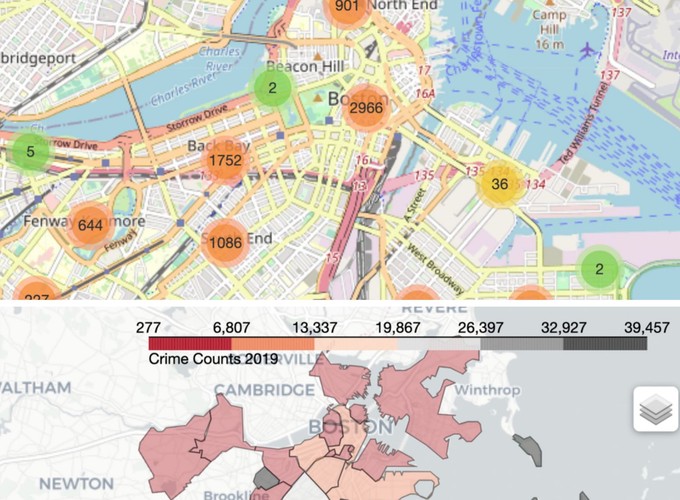
Además, al estar presente la latitud y longitud de cada crimen fue interesante proporcionar algunos mapas interactivos para visualizar el crimen total en la ciudad.
Marcadores de clúster
El primer mapa está destinado a mostrar los grupos de los crímenes ubicación exacta en la ciudad. Esto significa que, según el nivel de zoom, agrega los eventos más cercanos.

Choropleth Mapa
En segundo lugar, para tener una comprensión directa de la cantidad total de crímenes por barrio, he trazado un mapa de choropleth:

Machine Learning
Entre los modelos ML, he ajustado y equipado un *Random Forest y una Gradient Boosting Machine, para compararlos con una Regresión Logística. Para cada modelo, he calculado las métricas, la matriz de confusión y trazado algunas curvas métricas.

