Au long de ce projet, j’ai voulu explorer un ensemble de données de sedelmeyer/predicting-crime. Ce jeu de données contient plusieurs caractéristiques, qui sont expliquées dans le tableau suivant :
| Variable | Description |
|---|---|
lat and lon |
These are the latitude and longitude coordinates for each observed crime record. |
day-of-week |
This is a one-hot-encoded categorical variable split into the individual predictors Tuesday, Wednesday, Thursday, Friday, Saturday, and Sunday, indicating the day of the week during which the incident occurred. |
month-of-year |
This is a one-hot-encoded categorical variable split into the individual predictors Feb, Mar, Apr, May, Jun, Jul, Aug, Sep, Oct, Nov, and Dec indicating the month of the incident. |
night |
This is a binary variable indicating whether the crime occurred before sunrise or after sunset for the given day of the crime record. Sunrise and sunset times were derived from NOAA daily local climatological data for the City of Boston. |
streetlights-night |
This is an interaction term measuring the number of streetlights within a 100 meter radius of each crime record that occured at night. Daytime crime records are zero-valued for this predictor. |
tempavg |
This is the average dry bulb temperature in celcius for the City of Boston for the date on which each crime record occured. |
windavg |
This is the average daily windspeed in kilometers-per-hour in the City of Boston for the date on which each crime record occured. |
precip |
This is the amount of precipitation in inches that fell in the City of Boston for the date on which each crime record occured. |
snowfall |
This is the amount of snow in inches that fell in the City of Boston for the date on which each crime record occured. |
college-near |
This is a binary indicator identifying whether or not the crime occured within 500 meters of a college or university. |
highschool-near |
This is a binary indicator identifying whether or not the crime occured within 500 meters of a public or non-public highschool. |
median-age |
This is the median age of residents in the Boston neighborhood in which the crime record occured. |
median-income |
This is the median household income of residences in the Boston neighborhood in which the crime record occured. |
poverty-rate |
This is the proportion of residents living in poverty in the Boston neighborhood in which the crime record occured. |
less-than-high-school-perc |
This is the percentage of residents who achieved less than a highschool degree in the Boston neighborhood in which the crime record occured. |
bachelor-degree-or-more-perc |
This is the percentage of residents who attained a bachelor’s degree or higher level of education in the Boston neighborhood in which the crime record occured. |
enrolled-college-perc |
This is the percentage of residents enrolled in college in the Boston neighborhood in which the crime record occured. |
residential-median-value |
This is the annual median property value for all residential properties in the census tract and during the year in which the crime records occured. |
commercial-mix-ratio |
This is the ratio of total assessed value of commercial properities divided by the total assessed value of all properties in the census tract and during the year in which the crime record occurs. |
industrial-mix-ratio |
This is the ratio of total assessed value of industrial properities divided by the total assessed value of all properties in the census tract and during the year in which the crime record occurs. |
EDA
Je voulais reproduire une analyse exploratoire des données et quelques modèles d’apprentissage automatique à cet ensemble de données, car c’était extrêmement intéressant, plus super utile pour former plusieurs compétences de codage.

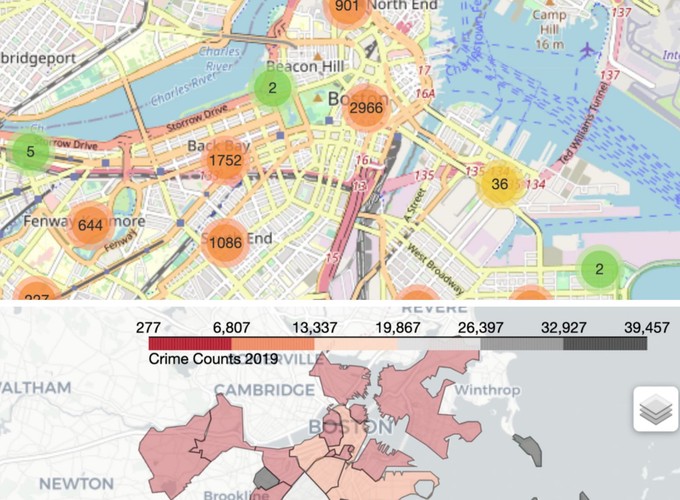
En outre, comme il y avait présent la latitude et la longitude pour chaque crime, il était intéressant de fournir quelques cartes interactives pour visualiser le crime total dans la ville.
Marqueurs de regroupement
La première carte est destinée à montrer les groupes de crimes l’emplacement exact dans la ville. Cela signifie que selon le niveau de zoom, il agrège les événements les plus proches.

Carte Choropleth
Deuxièmement, pour avoir une compréhension directe du nombre total de crimes par quartier, j’ai ensuite tracé une carte choropleth:

Machine Learning
Parmi les MLmodèles, j’ai réglé et installé une Random Forest et une Gradient Boosting Machine, pour les comparer avec une Régression logistique. Pour chaque modèle, j’ai ensuite calculé les métriques, la matrice de confusion et tracé quelques courbes métriques.

