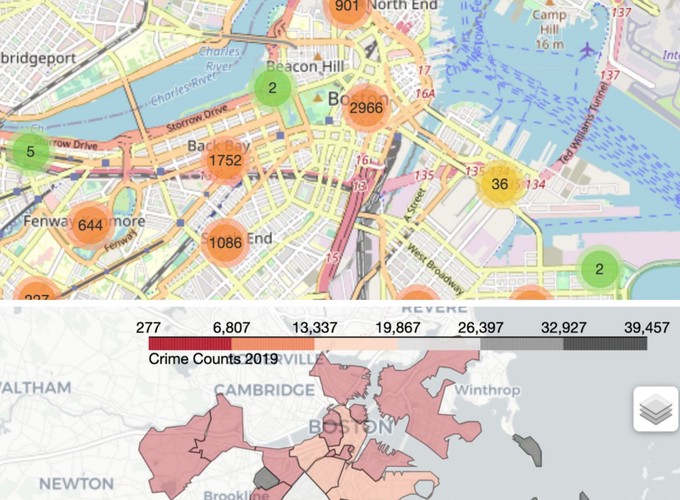
Nel corso di questo progetto ho voluto esplorare un set di dati da sedelmeyer/predicting-crime. Questo set di dati contiene diverse caratteristiche, che sono spiegate nella seguente tabella:
| Variable | Description |
|---|---|
lat and lon |
These are the latitude and longitude coordinates for each observed crime record. |
day-of-week |
This is a one-hot-encoded categorical variable split into the individual predictors Tuesday, Wednesday, Thursday, Friday, Saturday, and Sunday, indicating the day of the week during which the incident occurred. |
month-of-year |
This is a one-hot-encoded categorical variable split into the individual predictors Feb, Mar, Apr, May, Jun, Jul, Aug, Sep, Oct, Nov, and Dec indicating the month of the incident. |
night |
This is a binary variable indicating whether the crime occurred before sunrise or after sunset for the given day of the crime record. Sunrise and sunset times were derived from NOAA daily local climatological data for the City of Boston. |
streetlights-night |
This is an interaction term measuring the number of streetlights within a 100 meter radius of each crime record that occured at night. Daytime crime records are zero-valued for this predictor. |
tempavg |
This is the average dry bulb temperature in celcius for the City of Boston for the date on which each crime record occured. |
windavg |
This is the average daily windspeed in kilometers-per-hour in the City of Boston for the date on which each crime record occured. |
precip |
This is the amount of precipitation in inches that fell in the City of Boston for the date on which each crime record occured. |
snowfall |
This is the amount of snow in inches that fell in the City of Boston for the date on which each crime record occured. |
college-near |
This is a binary indicator identifying whether or not the crime occured within 500 meters of a college or university. |
highschool-near |
This is a binary indicator identifying whether or not the crime occured within 500 meters of a public or non-public highschool. |
median-age |
This is the median age of residents in the Boston neighborhood in which the crime record occured. |
median-income |
This is the median household income of residences in the Boston neighborhood in which the crime record occured. |
poverty-rate |
This is the proportion of residents living in poverty in the Boston neighborhood in which the crime record occured. |
less-than-high-school-perc |
This is the percentage of residents who achieved less than a highschool degree in the Boston neighborhood in which the crime record occured. |
bachelor-degree-or-more-perc |
This is the percentage of residents who attained a bachelor’s degree or higher level of education in the Boston neighborhood in which the crime record occured. |
enrolled-college-perc |
This is the percentage of residents enrolled in college in the Boston neighborhood in which the crime record occured. |
residential-median-value |
This is the annual median property value for all residential properties in the census tract and during the year in which the crime records occured. |
commercial-mix-ratio |
This is the ratio of total assessed value of commercial properities divided by the total assessed value of all properties in the census tract and during the year in which the crime record occurs. |
industrial-mix-ratio |
This is the ratio of total assessed value of industrial properities divided by the total assessed value of all properties in the census tract and during the year in which the crime record occurs. |
EDA
Ho voluto riprodurre un analisi dei dati esplorativa e alcuni modelli machine learning a questo set di dati.

Inoltre, poiché erano presenti la latitudine e la longitudine per ogni crimine, era interessante fornire alcune mappe interattive per visualizzare il crimine totale in città.
Indicatori di clustering
La prima mappa ha lo scopo di mostrare i gruppi dei crimini esatta posizione in città. Ciò significa che secondo il livello di zoom, aggrega gli eventi più vicini.

Mappa di Choropleth
In secondo luogo, per avere una comprensione diretta della quantità totale di crimini per quartiere ho poi tracciato una mappa di choropleth:

Apprendimento automatico
Tra i modelli ML, ho sintonizzato e montato una Random Forest e una Gradient Boosting Machine**, da confrontare con una *Logistic Regression**. Per ogni modello, ho poi calcolato le metriche, la matrice di confusione e tracciato alcune curve metriche.

